Physician's Notebooks 6 - http://physiciansnotebook.blogspot.com - See Homepage
Update 21 Aug. 2021
17.EKG, Electrocardiogram
Each normal heartbeat comes from electric impulse of pacemaker cells in the right upper entrance into the heart. The above, normal heartbeat trace shows several seconds of heart action and if continued would show the same trace repeating each second, or 60 beats per minute. This is the PQRST normal sinus rhythm. When an examiner inspects an EKG, he or she first looks to see if the heart rhythm is normal or not. The normal rhythm is as you see above - the size P wave followed by the size QRS followed by the size T wave and then after about 1 second the same sequence repeats. This inspection should form the first part (a regular sequence of PQRS as shown above at resting rates between 60 and 75 is normal sinus rhythm) of EKG diagnosis: Then answer the question: Is the rate or rhythm normal or not? And if not normal, what abnormal? Once the "What is the rate & rhythm?" is answered, the examiner inspects each wave and the intervals between the waves for abnormality. From the combination of "What rate and rhythm?" and the wave and interval abnormalities plus the physical and test exams and history, a diagnosis of the heartbeat normality is determined.
 When the P blip is not connected to a QRS (as in the just above EKG) the diagnosis is a complete (3rd degree) A-V heart block and the result is a very slow, irregular heartbeat originating in the ventricle of the heart. A person who develops a complete heart block usually has heartbeat 30 bpm or less and easily collapses and gets heart failure and strokes and then dies. It requires insertion of pacemaker.
Below is a ST segment elevation; a sign of impending Myocardial Infarct, as the below tracing, is a STEMI (ST elevation MI heart attack).

Each normal heartbeat comes from electric impulse of pacemaker cells in the right upper entrance into the heart. The above, normal heartbeat trace shows several seconds of heart action and if continued would show the same trace repeating each second, or 60 beats per minute. This is the PQRST normal sinus rhythm. When an examiner inspects an EKG, he or she first looks to see if the heart rhythm is normal or not. The normal rhythm is as you see above - the size P wave followed by the size QRS followed by the size T wave and then after about 1 second the same sequence repeats. This inspection should form the first part (a regular sequence of PQRS as shown above at resting rates between 60 and 75 is normal sinus rhythm) of EKG diagnosis: Then answer the question: Is the rate or rhythm normal or not? And if not normal, what abnormal? Once the "What is the rate & rhythm?" is answered, the examiner inspects each wave and the intervals between the waves for abnormality. From the combination of "What rate and rhythm?" and the wave and interval abnormalities plus the physical and test exams and history, a diagnosis of the heartbeat normality is determined.
Electrocardiography Intervention
Note the 6 chest leads - from the chest reader’s left to right V1 to V6 and the 4 limb applications that produce the 6 other leads by combinations. These limb-leads compute the direction of the electrical force of the heart. A direction of the electrical force toward the feet is normal. A direction toward the left arm is left axis deviation and toward the right arm is right axis deviation, each one caused by enlargements or thickenings of heart in respective direction from lesions and diseases.

EKG Diagnosis of Rate-Rhythm Abnormality: An accurate heart rate is got by counting the number of QRS peaks in 5 large box intervals (1 second) and multiplying by 60. If you have an irregularly beating heart, you must count all the beats in a 1 -minute interval.
The following below EKG tracings show a normal rhythm but too fast rate. A tachycardia is HR ≧100 per minute. The tracing shows a normal rhythm sinus tachycardia - normal rhythm with regular p wave preceding each QRS but with too fast rate 155 bpm. In absence of fever or exercise, a resting normal-rhythm tachycardia is due to heart failure, anemia or hyperthyroidism.
Tachycardia
Example 1: Sinus Tachycardia is EKG complexes of 100 or more per minute with a normal EKG complex of good regularity. It occurs due to over exercise, stress, dehydration, hyperthyroidism and many stimulant medications.
Bradycardia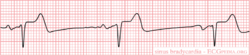

Bradycardia means too slow Heart Rate, less than 60 bpm. The one above is a sinus bradycardia with normal P before each QRS; it may be normal down to 50 for an athlete or one in training. But any rate below 50 bpm, and in all cases when there is an abnormal P-wave preceding each QRS; these, should be checked by EKG analysis.
Below is a ST segment elevation; a sign of impending Myocardial Infarct, as the below tracing, is a STEMI (ST elevation MI heart attack).
The ST segment extends from the end of the S wave to the start of the T wave (See topmost EKG wave ST segment). An ST segment would be normal if baseline was neither elevated nor depressed and it’s duration normal. Marked elevation of ST in left chest lead as above means Acute Myocardial Infarction (AMI, coronary artery heart attack). The finding helps rapid decision-making by paramedics to administer anti-clot medication on arrival at scene of someone with chest pain.

The downward sloping Q of Acute Myocardial Infarct below.The look of the Q is important in diagnosing heart muscle damage, the completed Myocardial Infarct. With a normal heart the Q is very shallow or absent. A deep, down-sloping Q is a key sign of destruction of heart muscle. It makes a diagnosis of MI and if acute (new, several hours to a day after the heart muscle injury) it should be accompanied by ST segment elevation for a diagnosis of ST elevation myocardial infarct, or STEMI. In the above EKG, the ST elevation is slight; later, months to years after the infarct, only the abnormal Q waves give evidence of previous infarct. Earliest stage of Myocardial Infarct has neither S-T elevation nor deep Q wave and is diagnosed by clinical history and high cardiac enzyme blood test and is called Non S-T elevation Myocardial Infarct (NSTEMI).
The tall sharp R wave below is left heart ventricle hypertrophy (too thick wall left heart chamber)wall thickening is diagnosed. This is a common finding with high Blood Pressure and a sign of its serious progression and emergency need for BP-lowering. LV


The below EKG shows a premature ventricular contraction (PVC)

The type of premature ventricular contraction (PVC; also "PC") depends on the origin of its electrical impulse. In the one just above, an origin in one of the heart ventricles is shown by the abnormal shape and size of the QRS. Before and following the PVC you can see a normal QRS that occurs after the previous QRS at exactly twice the usual interval between this patient's normal QRS's. The doubling of the interval is known as the compensatory pause and is typical of a single PVC. A PVC between normal PQRST beats is no worry but when 2 or more occur in a row it may be sign of irritable heart.
Atrial Fibrillation
Above EKG shows: Atrial fibrillation, 2 separate cases – the giveaway is the grossly irregular rate QRS's with no relation to a preceding P. (The P may not be seen as in the top row EKG tracing.) The lower tracing shows a varied form called “atrial flutter” where the P waves can be seen and there is a varying 3 or 4 to 1 block between the atria (very rapid P wave rate) and ventricular response (QRS) rate, about 1/3 or 1/4 the P wave rate.
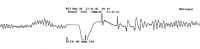
Ventricular Tachycardia: In the next below tracing, note there is no sign of a P, a QRS or a T, just repetitive up/down waves. Most VT starts as an abnormal PVC.

VT is the first event in progression to sudden death in athlete or other over-stressed person with apparently normal heart. ("A heart too good to die!") The HR in the above tracing is about 200 bpm; its symptom is a rapid fluttery feeling in chest with losing of consciousness in the minute without the usual preliminary signs of fainting. It requires immediate cardiac defibrillation with an AED (automatic emergency defibrillator). It is super-emergency for telephoning 911 in U.S.A. (119 in Japan).
Ventricular Fibrillation (VF), very fast low-volume sharp thin waves interrupted by a few beats of normal rhythm and then terminal VF and death.
 VF follows VT within minutes to seconds and if not quickly ended by AED shock, it ends in death. The sign of VF is a fainting, fluttery chest feeling even while lying flat or sitting. If it is you and alone, give 3 strong blows to your chest with fist and it may convert VF to normal rhythm. Then, if you are not already lying flat with face up, assume that position and make forceful coughs, repeatedly until rescuers, alerted from the start, start CPR and give an AED shock. One can only guess at VF without an EKG but it is a good guess (but bad luck) for any person who collapses under stress without history of previous heart disease, and little is lost by striking the chest 3 moderate blows and doing as advised above.
EKG Testing: The Duke Treadmill Walk Stress Test is standard for suspected coronary artery disease in absence of acute myocardial infarction (AMI) or its immediate preliminary stage, unstable angina. It is a screening test for pilots and athletes who may be at risk to develop an MI under stress. It is also a gateway to more invasive coronary artery tests. It has several variations - from the simple step-up, step-down attached to EKG test, to the graded treadmill exercise with attached echo ECG and EKG. The simple step-up, step-down test, accurately is good for the usual check for coronary artery disease in a symptomless person.The 24-hr Holter Monitor Test – tape recording of 24-hr continuous EKG – is routinely done for heart complaint suggesting arrhythmia because many arrhythmias only occur a few times for short runs in 24 hours and can easily be missed in routine EKG.
END OF CHAPTER. To read next now, click 6.18a Pacemaker Saves a Life - Read it Here!
Also check out The Slim Novels by clicking http://adventuresofkimi.blogspot.com
No comments:
Post a Comment